reversed yield curve.jpg

Inverted yield curve

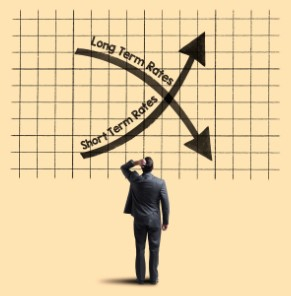
What is an inverting yield curve, and does it mean we’re heading for a recession?

One key predictor of downturns in the economy is what is known as the yield curve. This typically refers to the market for what the US government borrows by issuing bonds and other securities that mature over different time horizons ranging from weeks to 30 years.

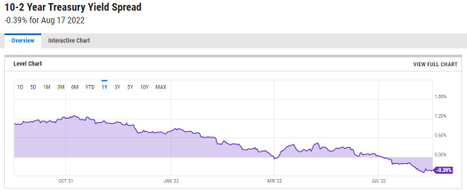
Each of these securities has its own yield (or interest rate), which moves up and down in inverse proportion to the security’s market value – so when bonds are trading at high prices, their yields will be low and vice versa. You can draw a chart that plots the yields of securities at each maturity date to see how they relate to one another, and this is known as the yield curve.

inverted curve 2.jpg

In normal times, as compensation for higher risk, investors expect higher rates of interest for money they lend over a longer time horizon. To reflect this, the yield curve normally slopes up. When it instead slopes down – in other words, when it inverts – it is a sign that investors are more pessimistic about the long term than the short term: they think a downturn or a recession is coming soon.

This is because they expect the Federal Reserve, the US central bank, is going to cut short-term interest rates in the future to stimulate a struggling economy (as opposed to raising rates to cool down an economy that is overheating).

Most closely watched is the relationship between two-year and ten-year US treasury debt. The so-called spread between these two metrics can be seen in the chart below, with the grey areas indicating recessions that have tended to follow shortly after.

10- 2yr treasury.jpg

Spread between two-year and ten-year treasuries

As you can see, the yields of these two securities are getting very close to being the same, and the trend suggests that the two-year will soon have a higher yield – meaning the curve is inverting. The key question is, does an inverted yield curve hint at an upcoming downturn? Not necessarily. Let me explain why.

inflation 6.jpg

Inflation expectations

  • One complication is that bond yields don’t only reflect what investors think about future economic growth. They also buy or sell debt securities depending on what they think is going to happen to inflation. It’s generally assumed that prices will increasingly rise in the years ahead, and investors need to be compensated for bearing that risk since higher inflation will erode their future purchasing power. For this reason, bond yields contain an element of inflation premium, normally with an increasingly higher premium for bonds with longer maturity dates.

The following chart shows the spread between the inflation expectations built into 10-year and 2-year treasuries. The fact that it is in negative territory suggests the market thinks that inflation may fall, and this may also explain why yields on longer-dated treasuries are lower than on shorter-dated ones. And although inflation would fall in the event of an economic slowdown or recession, there could be a situation where inflation fell, but the economy remained buoyant. Hence a yield curve inversion doesn’t have to mean that we are up against an imminent recession.

qe.jpg

Quantitative easing

  • Another factor that is potentially affecting the yield curve is the Federal Reserve’s moves to buy government debt as part of its quantitative easing program (QE). The idea behind QE is that by buying long-term bonds, the Fed is able to keep long-term interest rates low, which decreases the rates on mortgages and other loans, thereby stimulating the economy. Conversely, when sold, lending rates will go up, and economic activity will be reduced.

  • Earlier in March, the Fed started raising the benchmark US interest rate and stopped the asset purchases under the QE program that it launched in 2020 in response to the COVID pandemic.

But it also indicated that it would only start selling these assets after several months of hiking the benchmark rate. Since the benchmark rate is a short-term rate, the yield curve inverting might indicate market expectations that short-term interest rates will be higher than long-term ones for the foreseeable future.

Confused woman 1.png

Which yield curve should we consider?

It is also sometimes argued that two-year/ten-year spreads are not the most useful ones to watch and that instead, one should focus on yields at the shorter end of the yield curve. In this setup, if you look at the difference in yields between two-year and three-month treasuries, it is actually steepening: in other words, it is hinting that economic growth is going to increase in the short term.

Economists sometimes argue that these near-term yield curve movements have stronger predictive power than those further out. At the very least, the fact that these are saying something different shows the need to be careful because different data about treasury yields can depict a different (or even opposite) picture depending on what time horizon you are considering.

get organize 2.JPG

Spread between two-year and three-month treasury yields

To summarise, it doesn’t necessarily follow that an inverted yield curve will be followed by a recession. It certainly could mean that, in which case unemployment would likely rise, and inflation would potentially come down more quickly than many are expecting. But for now, it’s too early to say. The debt market is certainly signaling that change is coming, though it’s often easier to say in hindsight what it meant than at the present time.

bridging gap.png

Our job is to be your advocate

Our job is to be your advocate, your trusted person that you can rely on to advise you and ask the questions you don’t dare to ask. I also help you manage your financial expectations.

I am here for you all the steps of the way. I can assure you that you are a priority to me and the Financial Sherpa.

Understanding how your financial choices impact your life, strategizing for your future, and having a plan, are primordial to opening a new chapter of your life dedicated to YOU, YOUR needs, YOUR wants, and YOUR money.

  • Our process is built on experience and success. We leverage our expertise in wealth management to give you better control of your financial future.

step 1 Plan 1.png
step 2 Plan 1.png
step 3 Plan 1.png
step 4 Plan 1.png

WE ARE HERE TO HELP! Contact Us Us Today

What to Read Next?

inflation 1.png

What Causes Inflation and What to Do About It?

A huge challenge is planning for your retirement savings to outpace inflation.

Some of us may remember the “good old days,” when gasoline prices were as low as 25¢ per gallon. Others may recall when a can of soda cost 15¢. But prices tend to rise over time – sometimes steadily and sometimes abruptly. In the years ahead, inflation will most likely decrease the purchasing power of your money, which means that during retirement, your dollars will buy less than they do today.